I've been looking at the TCU recently and have located the shift plan and figured out how to decode it. The shift plan is composed of multiple shift maps. There is one shift map for each possible combination of mode, stick position, and current gear. Each shift map is comprised of an upshift curve and a downshift curve.
As an example: The UK TCU has 6 modes (Normal, Economy, Power, Manual, Cruise and Overheat). There are 4 stick positions (D,3,2,1) and obviously 4 gears (1st,2nd,3rd,4th). Therefore there are 6x4x4=92 shift maps in the shift plan.
The shifting decision is based on vehicle speed and throttle, not rpm. This is confirmed by the factory service manual. Let me demonstrate how it works with the aid of the Normal-StickD-Gear2 map and the Normal-StickD-Gear3 map.
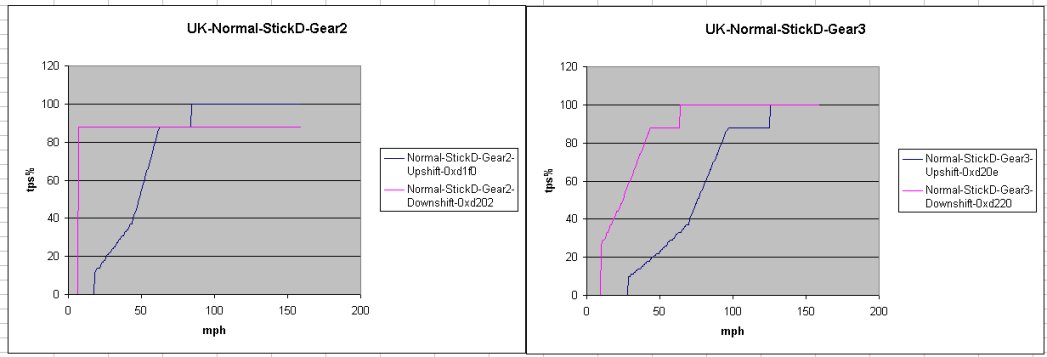
Suppose you are driving in Normal Mode, with the stick in D, at 50mph and 40% throttle. The gearbox is in 3rd gear. Imagine a dot at (50,40) on the 3rd gear map (the one on the right). If you floor the gas, the dot will move vertically up the chart. When you get to about 88% throttle, the dot crosses the downshift curve and the box changes down to 2nd gear.
Now the dot is on the 2nd gear map at 100% throttle and moving right as the speed increases. When you reach 85mph the dot crosses the upshift curve and the box changes up to 3rd gear.
That's the basic theory. Now lets look at some more pictures.
Here are the upshift and downshift curves for a USDM SVX in Normal mode, with the stick in D. I have superimposed the 4 maps into one diagram.
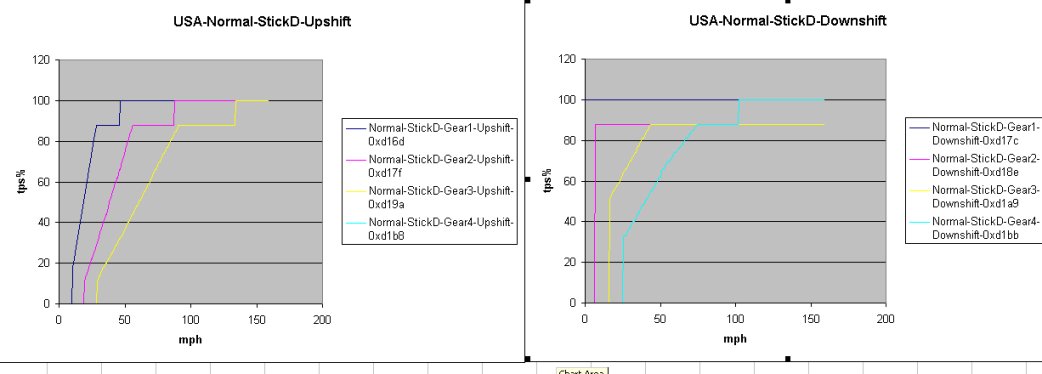
You will note that the gear1-downshift map is a horizonal line at 100% throttle, because obviously we can't downshift from 1st gear. Similarly, the gear4-upshift map is a horizonal line at 0% throttle because we can't upshift from 4th gear.
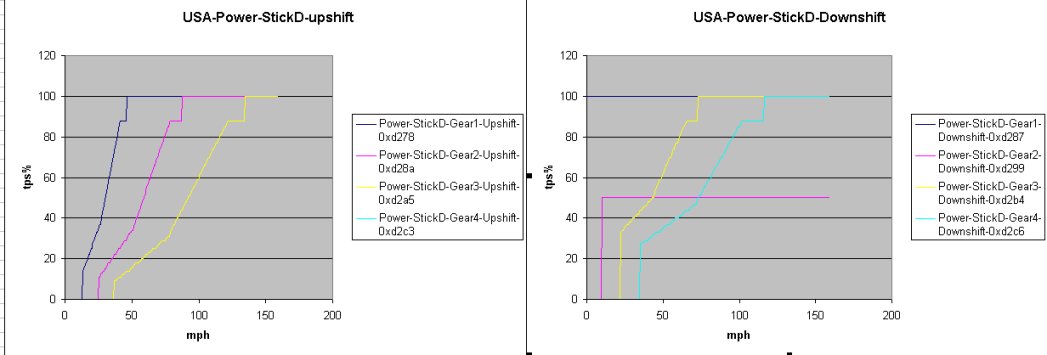
If you compare the Power mode curves you can see that in Power mode, the TCU upshifts at a higher speed, and needs less throttle push to trigger a downshift. At 60% throttle it will change from 2nd to 3rd at 64mph in Power mode compared to 43mph in Normal mode. If you squeeze the gas pedal at 50mph in 4th, Power mode will downshift at only 35% throttle whereas Normal mode requires 62%.
The USDM TCU is a little more complex than the UK version. It has 7 modes (Normal,Power,Manual,Cruise,LowPres1,LowPres2,Over heat) and therefore 7x4x4=112 maps. The LowPres1 mode is activated when the atmospheric pressure is low. The LowPres2 mode is activated when the atmospheric pressure is very low. The TCU uses power mode if the atmospheric pressure is very very low. I have no idea why Subaru would need different shift maps based on atmospheric pressure. Perhaps to compensate for reduced engine power at altitude? Only the USA model has this feature, the UK and JDM don't even have a pressure sensor.
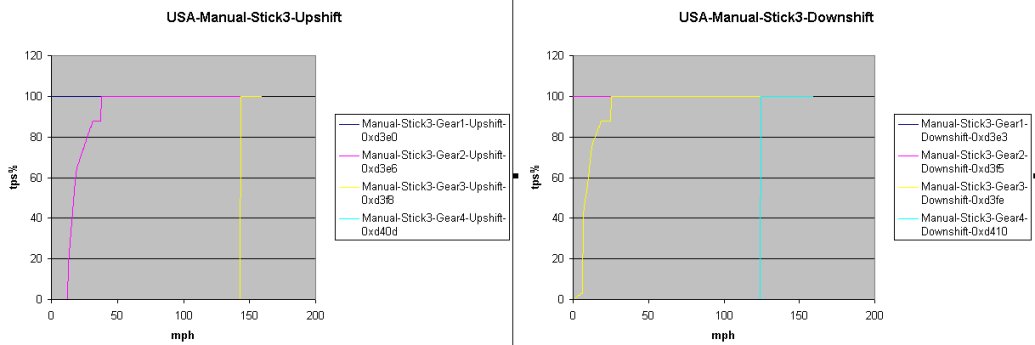
Now for yet another answer to the FAQ "What does the manual button do?". Below are the maps for Manual Mode with the Stick in 3. You can see that the car will start in 2nd but then upshift to 3rd almost immediately and then hold 3rd right up to 143mph. On the downshift, it will hold 3rd all the way down to almost a standstill. When the stick in is 2 (not on this diagram), the car will start in 2 and hold it right up to 91mph. Essentially, Manual mode does its very best to keep you in the gear you have selected on the shifter.
The JDM model has only 5 modes (Normal, Power, Cruise, Manual and Overheat), however there is data for 2 extra maps that never seem to get used. I was expecting that the Normal and Power maps would be the same between JDM and UK models, but they are not. Here is a comparison of the upshift maps between the two models.
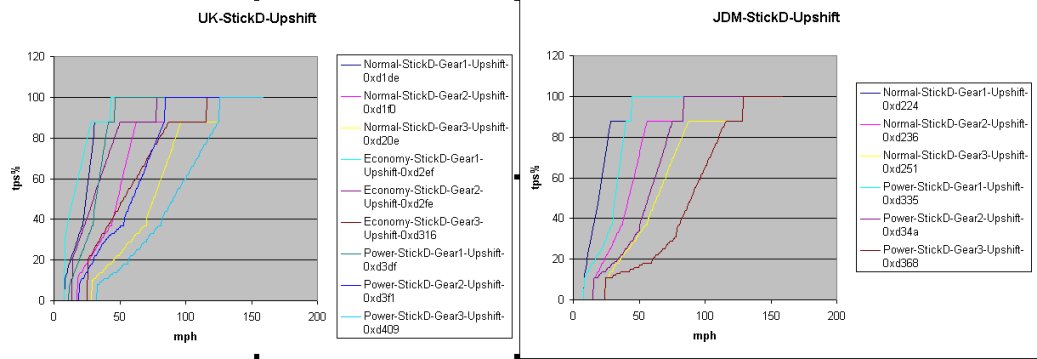
It appears to me that the UK Economy mode is slightly more relaxed than the JDM Normal Mode while the UK Normal Mode is slighly more aggressive than the JDM Normal Mode. ie. The JDM Normal mode is inbetween UK Economy and Normal. The UK Power mode is also more aggressive than the JDM Power mode. There is no point in comparing the USDM maps without some way to compensate for the different diff ratio.
I have extracted the maps into a big Excel spreadsheet attached to this post. So you can have a play with it if you are interested. To plot a graph, first select the tab for the version of car: UK, JDM, USDM. Select column A or B depending on whether you think in mph or km/h. Then hold CTRL and select additional columns for the maps that you want to include in the graph. As a first attempt, try columns C,E and G (Normal-StickD-Upshift maps for each gear). Then click on Insert/Chart. Select the "XY Scatter" chart. Click on the last icon "data points connected by lines without markers". Then Next/Next/Next and admire the pretty picture.
Having decoded the shift plan, I'm pretty confident that I could modify it and I'm already thinking about loading the UK power mode maps into one of my JDM cars. Plus, maybe an improved version of the as-yet-untested power mode mod for UK cars. But there's a few more things I need to figure out first, like the torque converter lockup for example.